How to improve your website's performance: what I learned going from 44 to 98
A low performance score can have several causes, and the right fix only shows up when you measure it right.
5 min read
- kastavo
- performance

Last week I decided to measure Kastavo's performance for real, instead of just trusting the feeling that "it seems fast". I used a performance scanning tool I found online, and the first result was worse than I expected: a score of 44 on a scale of 0 to 100. LCP (the time until the largest visible element shows up) of 7.2 seconds, TBT (total blocking time) of 3.6 seconds — both in the "poor" range.
I started investigating calmly, one cause at a time.
Finding 1: every page loaded everything
The first problem was structural: the Home page — and, in fact, every page on the site — was loading the libraries of all 100+ tools, not just the one the person was using. That meant downloading PDF, video and OCR processing code even for someone who only wanted the word counter.
The fix was to separate the tool catalog (metadata, light) from the loading of each tool itself (heavy, only when needed). The result: the Home page dropped from 2.3 MB of JavaScript to under 900 KB.
Finding 2: a hidden redirect
The second problem was subtler: every visit to the site's root (kastavo.com/) went through a redirect to the right language (/en, /pt or /es), and that extra step cost more than half a second in the simulated measurements. The fix was to make the root answer with the content right away, with no hop, for people using the default language (English). Anyone who prefers Portuguese or Spanish is still sent to the right version, with the language detected the same way as before.
Finding 3: the cookie notice was the screen's "largest element"
This was the most unexpected one. The most important performance metric (LCP) was being held back by the cookie notice, which only drew after the JavaScript finished loading. The solution was to make the notice come ready in the HTML from the very first moment, waiting for nothing.
The plot twist: the numbers changed depending on where I measured
After those fixes, I ran the test again expecting everything to be solved — and the result was still strange: sometimes 65, sometimes 68, not matching what I saw in my own browser. I ran it several more times and realized the numbers simply weren't consistent with each other.
I decided to stop trusting that single number and cross-check with a reference source: Google's own PageSpeed Insights. It uses the same measurement engine that runs in the browser (Lighthouse), but on Google's servers, and it also shows data from real users when a site has enough traffic (Kastavo doesn't yet, and the panel says "No Data").
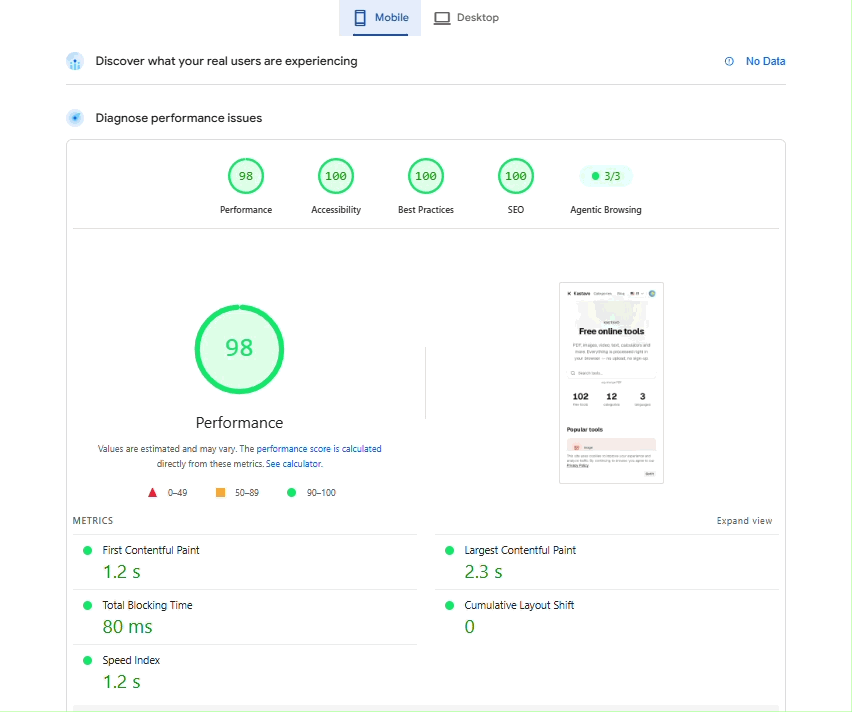
The result was very different: 98 for performance, 100 for accessibility, best practices and SEO; an LCP of 2.3 seconds and a TBT of 80 milliseconds. It was exactly what the fixes should have delivered — it's just that the first tool I used to measure, for some reason, wasn't reflecting that reliably.
The lesson that stays
This taught me something that goes beyond performance: a measuring tool isn't neutral — each one simulates different conditions (connection type, processor speed, location of the test server), and a single number can mislead. When the result doesn't match what you see in practice, it's worth cross-checking more than one source before assuming the problem is yours.
Today Kastavo really does load fast, not just "seem" fast — and now I trust that because I measured the right way, not just once.
Want to test your own site? Go to PageSpeed Insights, paste your address and see the performance score for mobile and desktop.
Frequently asked questions
LCP (Largest Contentful Paint) is the time until the largest visible element on screen appears, such as a big image or a block of text; up to 2.5 seconds is considered good, and over 4 seconds, poor. TBT (Total Blocking Time) adds up the periods when the page was stuck, not responding to the user, while it loaded; it is a lab metric, and up to 200 milliseconds is good. The performance score is Lighthouse's 0 to 100 grade, which combines several metrics with different weights: 90 to 100 is green, 50 to 89 is orange and below 50 is red.
Because each one measures under different conditions: the simulated connection speed, the processor power of the test machine, the server's location, the tool's version and even how the simulated slowdown is applied. On top of that, the same test repeated varies a little from run to run. That is why it is worth running it more than once, always comparing in the same tool over time, and cross-checking with a reference source.
In part. Google uses the Core Web Vitals (LCP, INP and CLS), measured with real users, as one of its ranking signals, but it is one signal among many, and the relevance of the content weighs more. The Lighthouse score itself is not a ranking factor. A fast site with weak content will not climb just for that, but a slow site hurts the people using it, and that matters on its own.